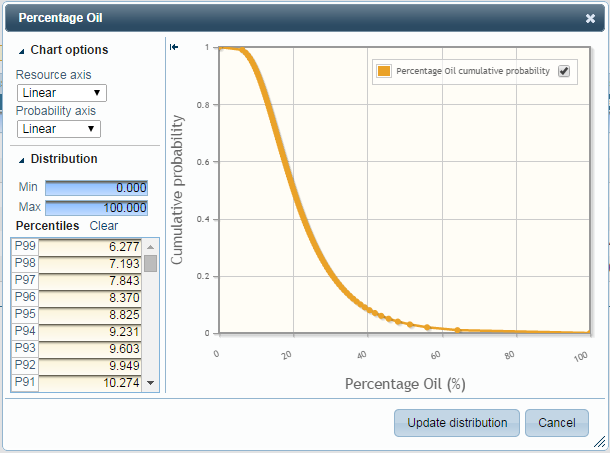
dbMap/Web – Custom Distributions
Custom distributions are intended for specific cases where none of the pre-defined distributions are suitable and should be used sparingly.
To create a custom distribution, change the distribution type to “Custom” and then click the “edit” link to open the custom distribution editor.
To get started, enter the minimum and maximum values for the distribution. These define the range and are mandatory values.
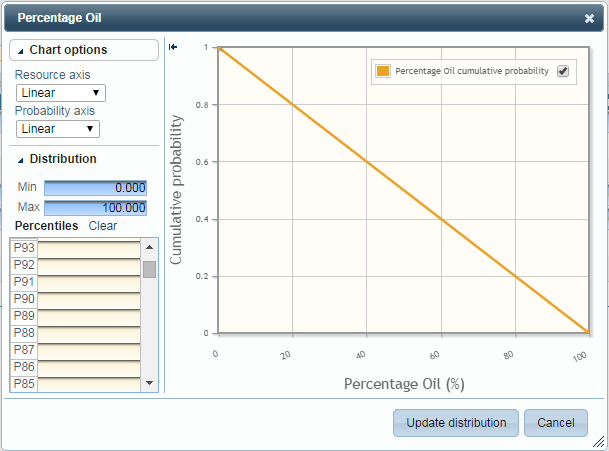
Editing Percentiles
Entering only the minimum and maximum values gives the equivalent of a uniform distribution. This can be enhanced by entering values for the percentiles. These are all optional, and linear interpolation is used to derive any that are not populated.
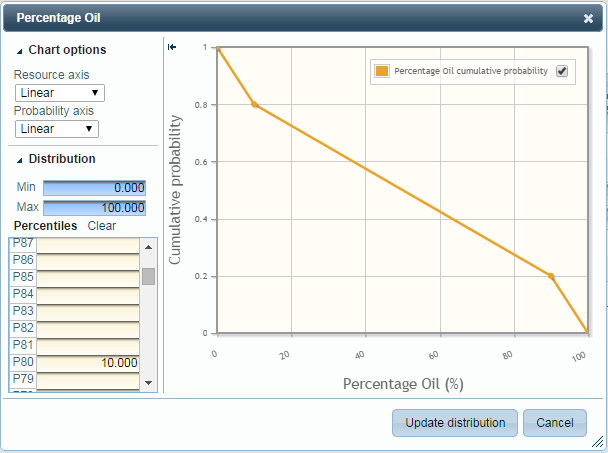
When a percentile value is set, a new point will appear on the chart. The percentile value can be changed by editing the value in the text input, or by dragging the point on the chart.
Clicking “Clear” will clear all of the percentile input boxes.
When changes to the custom distribution are complete, click “Update distribution” to update the main resource computation screen. The resource computation can now be re-computed and saved as usual.
Pasting from Excel
If the percentiles are generated in Excel, they can be populated in dbMap/Web by pasting directly into the first input box.
The percentiles must be in a single Excel column. Highlight the values, and copy to the clipboard (Ctrl+C or right-click, Copy):
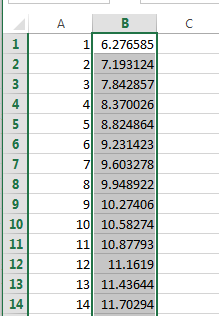
Then select the input box that the first percentile value should be pasted into:
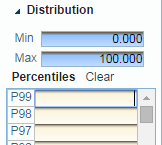
To paste, press Ctrl+V, or right-click and select Paste:
