dbMap/Web – Depth-Area Compute Method
The depth-area method is similar to GRV, but uses depth-area data to compute the volume, rather than it being entered directly.
There are six depth-area methods available:
Depth-Slice Area Method
Depth-Area Top (Constant Thickness)
Depth-Area Top (Variable Thickness)
Depth-Area Base (Constant Thickness)
Depth-Area Base (Variable Thickness)
Depth-Area Top & Base Structure
The Depth-Slice Area Method specifies a single depth-area relationship as a series of depth and slice areas, where the slice area is the 'net' area, taking into account any influence of a base structure.
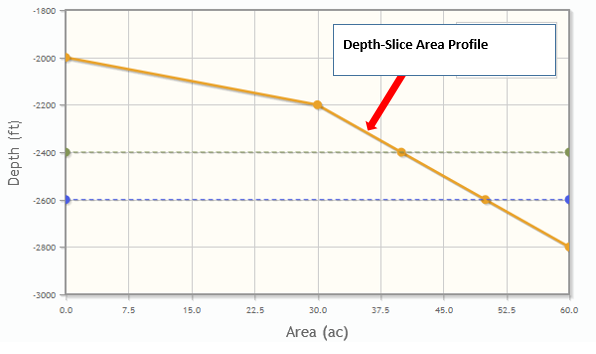
This is adequate if one has a reservoir that is roughly cylindrical, resembling a “pool” of hydrocarbon with no noticeable variation in shape.
However, depending on the actual structure one is trying to model, this method may not be suitable. Other methods are provided to allow for a more accurate structure representation.
These other depth-area methods rely on a specification of top and base depth-area profiles. These profiles that can be visualised on the chart below:

For any iteration, GRV is determined as the difference between the two profiles down to the Spill Point. GRV Gas is determined as the difference between the 2 profiles, from the top of structure down to the Gas-Oil contact, for Gas-Oil targets, or to the Gas Water contact for Gas only targets, or the spill point, whichever is shallower. GRV Oil is determined as the difference between the 2 profiles, from the top of structure, for oil only targets, or from the Gas Oil contact for Oil-Gas targets, down to the Oil water contact or spill point, whichever is shallower.
From this point on, the computation proceeds in the same way as the GRV method.
For all methods, area values are always fully correlated with one another. So that if, for some iteration, the area at a particular depth is the P90 for that area distribution, the areas for every other depth will also be the P90 for their distributions for that iteration. This is done because if the areas at different depths were uncorrelated, the simulated reservoir in the computation would likely take on impossible shapes.
Each method is explained as follows:
1. Depth-Slice Area Method
For each depth, a pre-calculated “net” area slice is specified. In the figure below, this would be the “doughnut” area in the second depth area entry.
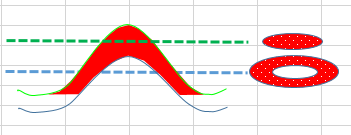
The GRV is computed by adding together the volume of each “slice” between the successive depth values. A simple linear average is used to obtain the average area for each slice.
From this point on, the computation proceeds in the same way as the GRV method.
Each depth-area 'pair' defines the area of the reservoir at a particular depth. The depth must be a single value, but the area can be specified as a probability distribution to represent uncertainty in the estimate.
These depth-area pairs are entered on the Depth-Area tab:

Depths are entered as sub-sea values – the smallest depth value will be the reservoir top depth.
As with other values, depths can be entered in metric or imperial units, depending on the selected mode. This is toggled using the Metric/Imperial button.
2. Depth-Area Top (Constant Thickness)
For this method, the specified depth-area relationship pertains to the top structure. A base structure depth-area relationship is then determined by projecting the top structure depth-area relationship down by the thickness value (gross interval).
Gross Interval can be specified as a constant value, or as a distribution. For each iteration, the same gross interval is applied to each depth to generate the base structure depth-area relationship:
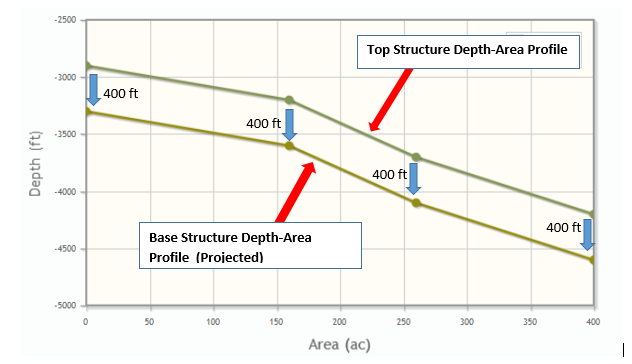
The volume is determined by integrating the depth-area profile of the top structure and subtracting the base structure depth-area profile integration.
For each Depth-Area pair, the depth must be a single value, but the top structure area and gross interval can be specified as a probability distribution to represent uncertainty in the estimate.
These depth-area 'pairs' are entered on the Top Structure Depth-Area tab, and the Gross Interval, Contact and Spill Point depths on the Geology tab:


3. Depth-Area Top (Variable Thickness)
This method is similar to the Depth-Area Top (Constant Thickness) method, however a separate thickness or gross interval can be specified for each depth in the top structure depth-area relationship. A base structure depth-area relationship is then determined by projecting the top structure down, using the specified gross interval at that depth.

The volume is determined by integrating the depth-area profile of the top structure and subtracting the base structure depth-area profile integration.
For each depth-area pair, the depth must be a single value, but the top structure area and gross interval can be specified as a probability distribution to represent uncertainty in the estimate.
These depth-area-gross interval 'triples' are entered on the Top Structure Depth-Area tab, and the Contacts and Spill Point depths on the Geology tab:


4. Depth-Area Base (Constant Thickness)
This method is similar to the Depth-Area Top (Constant Thickness) method, however the base structure depth-area profile is entered together with a thickness or gross interval that is applied to each depth. The top structure depth-area profile is the projection of the base structure upward using the gross interval.
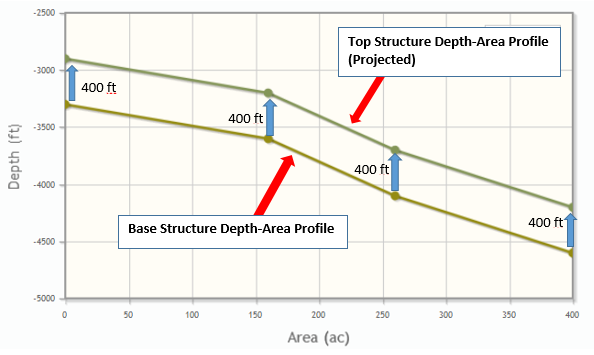
The volume is determined by integrating the depth-area profile of the top structure and subtracting the base structure depth-area profile integration.
For each depth-area pair, the depth must be a single value, but the base structure area and gross interval can be specified as a probability distribution to represent uncertainty in the estimate.
The depth-area 'pairs' are entered on the Base Structure Depth-Area tab, and the Gross Interval, Contact and Spill Point depths on the Geology tab:


5. Depth-Area Base (Variable Thickness)
This method is similar to the Depth-Area Top (Variable Thickness) method, however the base structure depth-area profile is entered, coupled with a thickness or gross interval at each depth. A top structure depth-area relationship is then determined by projecting the base structure upward, using the specified gross interval at that depth.
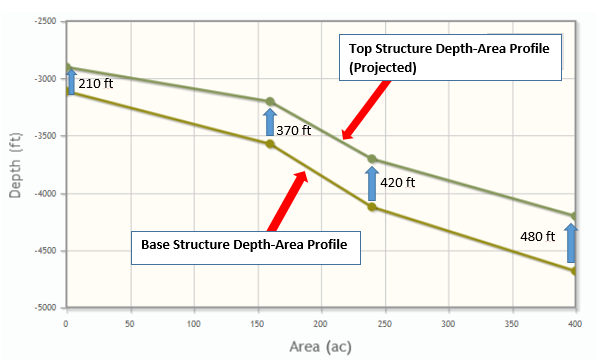
The volume is determined by integrating the depth-area profile of the top structure and subtracting the base structure depth-area profile integration.
For each depth-area pair, the depth must be a single value, but the base structure area and gross interval can be specified as a probability distribution to represent uncertainty in the estimate.
These depth-area-gross interval 'triples' are entered on the Base Structure Depth-Area tab, and the Contacts and Spill Point depths on the Geology tab:


6. Depth-Area Top & Base Structure
This method allows for the separate specification of the top structure depth-area profile and a base structure depth-area profile. Unlike the other methods, no thickness or gross interval is specified. This is determined from the top and base structure depth area profiles.
The volume is determined by integrating the depth-area profile of the top structure and subtracting the base structure depth-area profile integration.
For each depth-area pair, the depth must be a single value, but the top and base structure areas can be specified as a probability distribution to represent uncertainty in the estimates.
The depth-area pairs for the Top Structure are entered on the Top Structure Depth-Area tab, and the depth-area pairs for the Base Structure are entered on the Base Structure Depth-Area tab:


Contact Points
All depth-area methods include input variables for the oil and gas contact points, which define the extent of the volume calculation. The gas volume is calculated as the volume below the reservoir top and above the gas contact, while the oil volume is the volume below the gas contact and above the oil contact.
The range of depth values must extend at least to the maximum contact point depth in order for the computation to run successfully. For this reason, it is preferable to use a bounded distribution like Triangular, or Stretched-Beta for the contact points to ensure that there are no outlying values outside the depth range.

Unlike other compute methods, the Oil Percentage variable cannot be edited, as it is computed from the relative volumes of oil and gas.
Spill Point
Reservoir spill point can be specified for all methods with the exception of the Simple Depth-Area method. Spill point is the maximum extent of the gross rock volume (GRV). For each iteration, no depth below this will be considered.
Column Height
The column height feature is available for all methods with the exception of the Simple Depth-Area method.
It is limited to Oil or Gas hydrocarbon types, and not available for the Oil and Gas hydrocarbon type.
Column height refers to the vertical column of hydrocarbon present in the reservoir.
The column height feature has the following options:
Not used – no threshold should be considered
Limiting Column Height
This option can used when there is an expectation that, due to the seal capacity of the overlying rock, the column height can only reach a threshold value, at which the pressure exerted by the hydrocarbon is just below that at which the sealing rock will fail and allow hydrocarbon to pass through the seal.
This option will truncate the hydrocarbon-water contact or spill point to the threshold value. This means the spill point and hydrocarbon-water contacts cannot be deeper than the specified threshold column height.
Degree of Fill
This option can used when previous discoveries indicate that if a certain threshold column height is reached, the column height will extend to the spill point of the trap, i.e. will be 100% filled. This can occur in highly prolific hydrocarbon provinces.
When using this option, the hydrocarbon-water contact will assume the spill point depth, thereby making the degree of fill 100% hydrocarbon, when the column height exceeds the specified threshold value.
Profile Chart
A 'Profile Chart' is available for all Depth-Area Methods. It provides a means to check and confirm the representation of the depth-area relationship is as expected.
If Method 6:Top Structure Area/ Base Structure Area method is being used, the Profile Chart is a valuable tool to check whether overlapping profiles have accidentally been defined.
Overlapping profiles are possible in method 6 because the series of depth data are independent. So, even with all area distributions being fully correlated, it can happen. However, as the distributions are 100% correlated, one can say that no iteration will overlap if MIN and MAX don't overlap. That's when the chart comes into play. It's also good to check if one has defined a very “odd” reservoir, with volume variations bigger or smaller than they should have been.
The chart also shows the top of the structure: the point where the areas are zero. All detailed methods need this information for an accurate computation. So, one must define an entry with an area equal to zero for them to work. In the “simple” method, as a pre-calculated slices are being given, this was not necessary.