Introduction
dbMap/Web has an interactive map that can show and hide layers of information, see the relative distance between objects and identify Wells, Permits, Seismic Lines and other objects on the map.
Maps in dbMap/Web
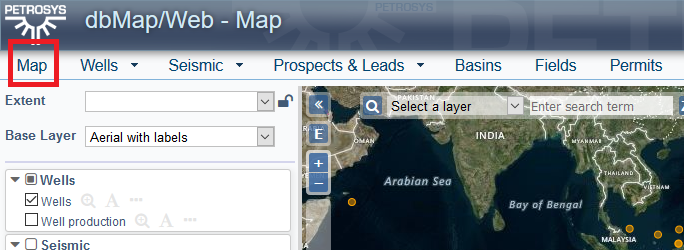
The main menu has a ‘Map’ option that displays a map with some pre-configured content:
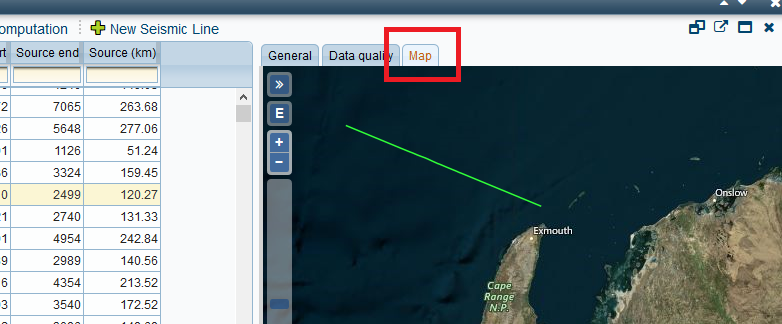
You will also see a map on the ‘Map’ tab if it has been configured for a panel: (eg Wells, Basins etc..)
A map is also displayed when selecting ‘Map Extent’:

The Well dashboard displays a map on the ‘Location’ tab

Using the control panel
The map’s control panel is on the left hand side of the map and is used to change what is seen on the map.
The control panel can be resized by dragging it’s right border and it is collapsed by default in some places.
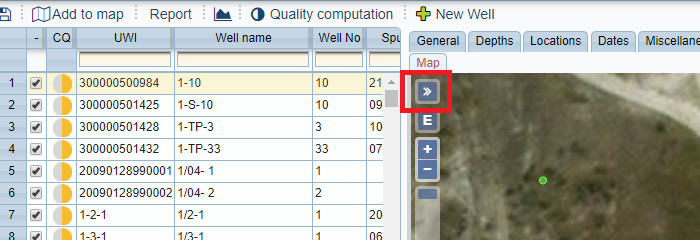
Click on the double-arrow icon on the top-left of the map to open and close the control panel:
Choosing an extent
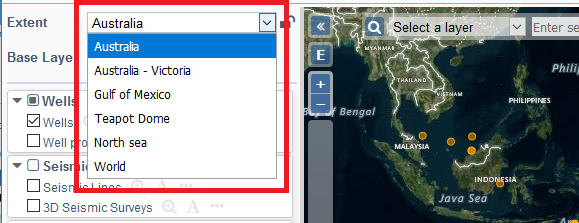
The control panel allows you to change the map to some pre-configured extents:
Choosing a base layer
The control panel allows you to select a base layer to use for background imagery. Some base layers are pre-configured by default:
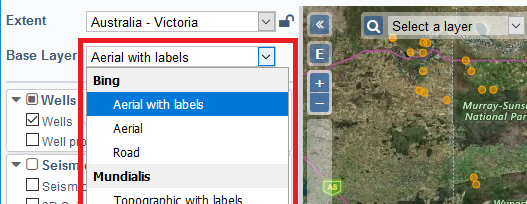
Base layers are usually provided by an external service. If the external service becomes temporarily unavailable, no base layer will be shown and you can select an alternate base layer. Some imagery providers require a paid subscription (For example Bing requires your company to have a subscription with Microsoft).
Changing layers
The control panel has a list of grouped layers that you can re-order by dragging up or down, and toggle visibility on or off:
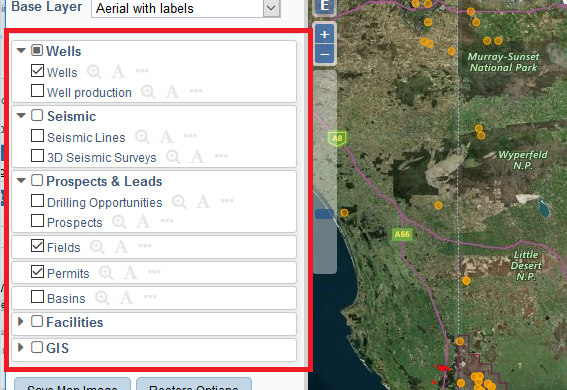
Each group of layers can be:
Collapsed or expanded using the arrow icon top-left of each group
Toggled all visible or hidden with the checkbox next to the group name
Dragged up or down to change the display order on the map
Within each group of layers, each layer can be:
Toggle visible or hidden with the checkbox next to the layer name
Dragged up or down within the group to change the display order on the map
Click on the magnifying glass icon to zoom to the extent of all items on that layer.
Click on the ‘A’ icon to toggle annotations visible or hidden
Click on the ellipsis ‘…’ icon to change layer options
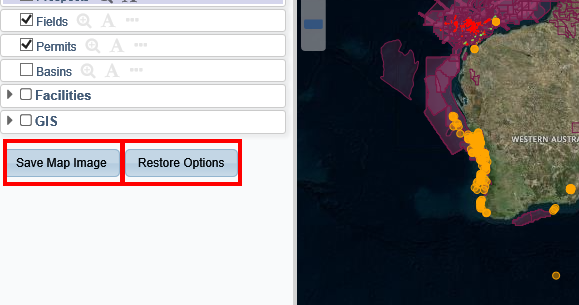
At the bottom of the control panel there are 2 buttons:
The “Save Map Image” button will save the map you’re seeing as a PNG file. If you do not see this button, it means that the server hosting the base layer you have chosen does not allow saving images.
The “Restore Options” button will erase layout, visibility and colour changes you may have made and replace them by the map’s original default settings.
Displaying user-selected items on the map
You can add your own user-selected items to the map by searching for them in other parts of dbMap/Web and adding them to the map.
Each time you add user-selected items, they are added to the existing map that is visible from the ‘Map’ menu.
To add user selected items to the map:
Choose what to add (Wells, Basins, Seismic lines etc..)
Use search, filters or lists to select some of the records
Toggle any off you don’t want to add to the map using the ‘Select/Unselect’ check box
Click the ‘Add to map’ button

Your user-selected items will be displayed in a different colour on the top of the other layers:
You can also use the ‘Map extent’ button to draw a rectangle around your area of interest:
Choose what to add (Wells, Basins, Seismic lines etc..)
Click the ‘Map Extent’ button to display the map
Pan and zoom to find your area of interest
Hold CTRL while dragging the mouse to draw a rectangle
When you release the mouse, all items within the rectangle will be selected
Turn off any you don’t want using the ‘Select/Unselect’ check boxes
Click the ‘Add to map’ button
If you already have a user selection layer of the same type (eg Wells) then your new user-selected items will be added to it.
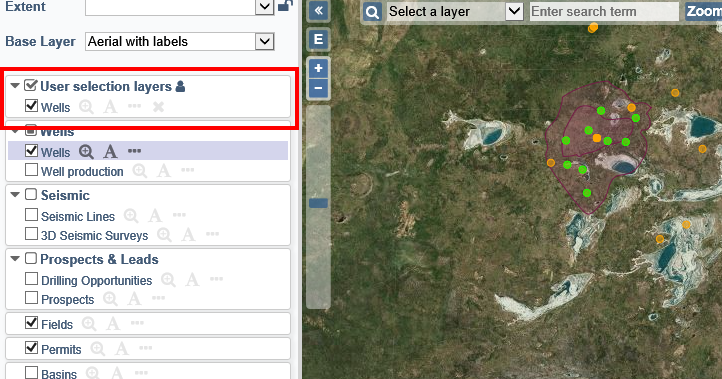
User selection layers can be re-ordered and zoom to extent like other layers. User selection layers can be removed from the map with the ‘x’ icon.
Navigating the map
Pan the map by dragging (click – drag – release)
Zoom with
the scroll wheel on your mouse
the plus and minus buttons on the map
the slider on the map
hold SHIFT while dragging to draw a rectangle and zoom to that
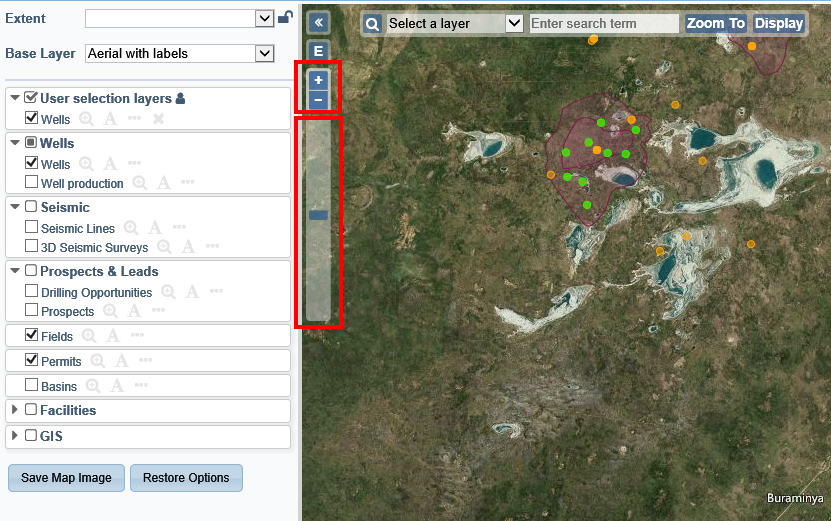
Across the bottom of the map, there is a scale bar and the current location of the mouse cursor is reported:
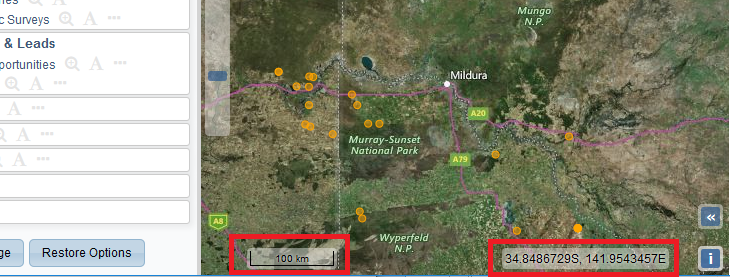
There is a location map, bottom right, if you are zoomed in close and want to check your surroundings without zooming out. It has a small blue box that represents the large map view and this box can be dragged around to pan your view in the main map.
Close the location map by clicking on the small double-arrow button bottom left.
You can maximise the map to full screen with the button top right:
Press ESC to return to the default window size.
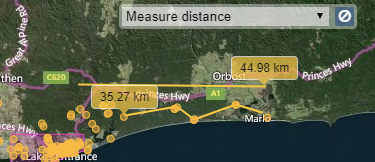
There is a measuring tool that is available on the map from the ‘Map’ menu:

Chose ‘Measure distance’
Click once to start drawing
Move to the end of the distance you want and double-click to stop drawing:
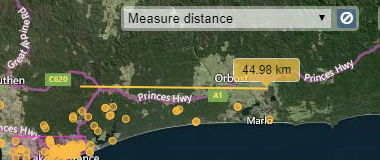
You can single click to draw consecutive line segments, then double-click to stop drawing:
‘Measure area’ works in a similar way:
Click the first point of your polygon
Keep clicking new points to draw your polygon
At the final point, double-click to complete your polygon back to the starting point
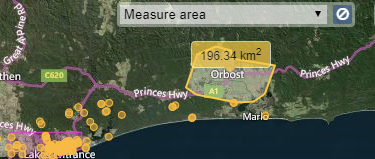
Click the cancel button or choose the option ‘Select a measurement option’ to clear your drawings.
You can also zoom to a set of features you search for on any available system layer. To do this, use the search tool available at the upper left corner

Select one of the available layers, then type in a search phrase. This can be whole or part words, including numbers and symbols.
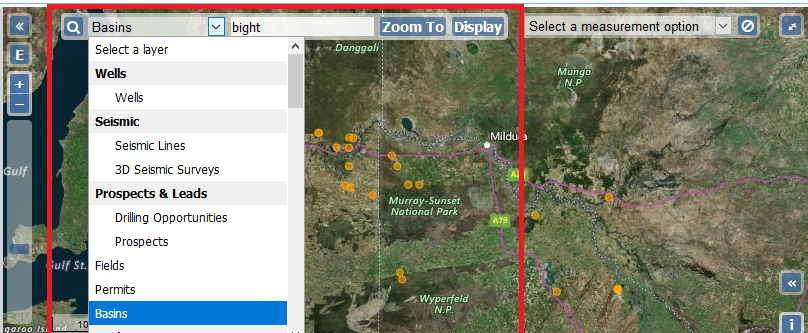
If you press Enter or click the ‘Zoom To’ button, the extent will change to encompass the features found, however if that layer is not visible, nothing will be shown.
If you press the ‘Display’ button, the found features will be added as a visible User selection layer.
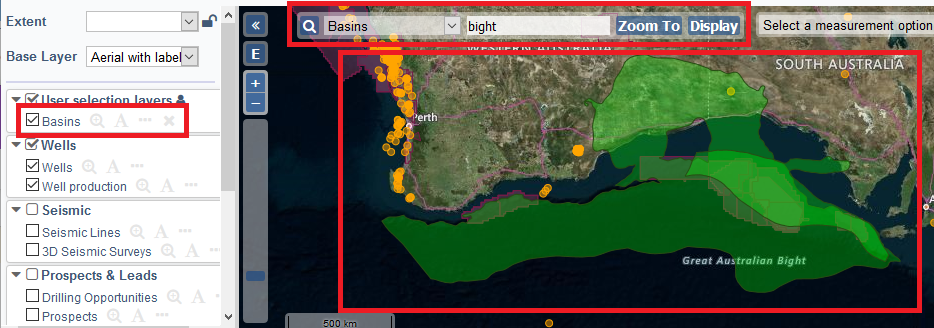
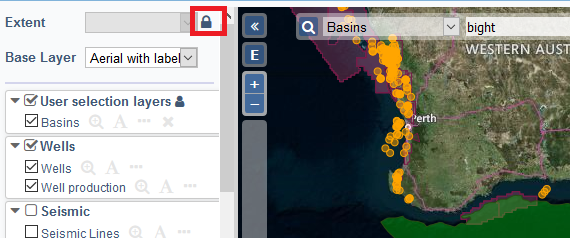
You can also “lock” your view of the map to the area you’re seeing, preventing accidental clicks on the “zoom” buttons or accidental dragging from taking you out of your preferred, or working view. To do this, position the map where you want, by any means, and click on the small “padlock” icon to the right of the extent selection box.
In “locked” mode, you won’t be able to select a new extent (unless you unlock the map) and dragging will be limited, so that the centre of the locked extent is always visible. Additionally, it will still be possible to zoom in, but it won’t be possible to zoom out.
To unlock the map, just click on the padlock icon again, opening it.
Identifying features on the map
Click anywhere on the map to see a list of features that are visible on the map at that point:
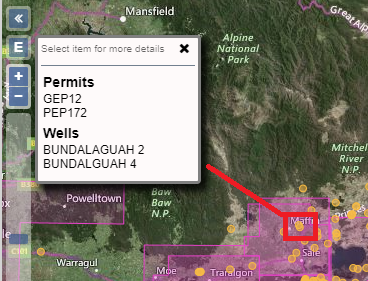
Click on any of these to see more details as you would normally see on a dbMap/Web panel. If there’s only one feature on the list, the details panel will be automatically opened for you.
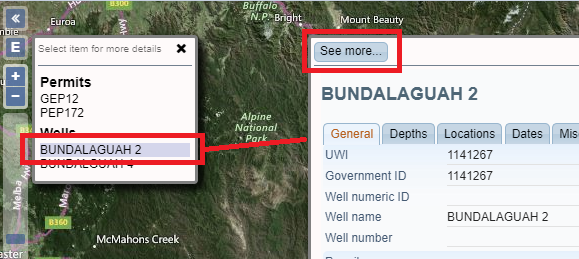
Click on the ‘See more...’ button to view the same record and all of its related information in a new dbMap/Web window. Whether this window will be a pop-up over the map or the main window itself is configurable via an SQC option in panel_settings.sqc. If the main window is chosen (this is the default), dbMap/Web will navigate to the corresponding panel and display complete details from there.
Features that are in child blocks, such as GIS related ones, can only have their details displayed on pop-up windows. So, even if the “same window” option is in place, dbMap/Web will use the “popup” mode for these cases.
The selected feature (Well, Field, Basin and others) may have additional shortcuts to additional information configured. In these cases, additional buttons will be displayed above the top bar.
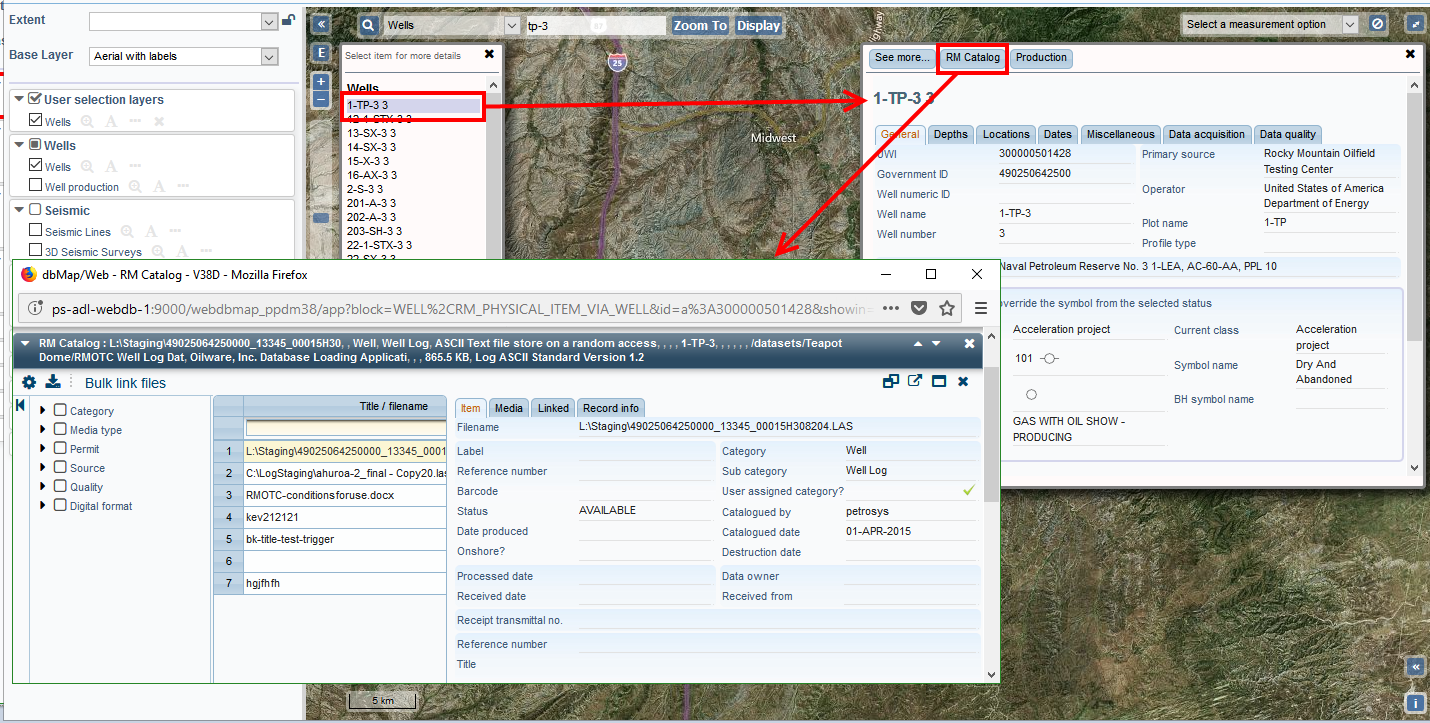
These buttons can be used to directly access the information they point at, without the need to pass through the “main” data screen, activated by the “See more...” button. Different kinds of feature can have different buttons configured.
Customisation Options - Making the Map “Your Map”
You can customise a fair number of elements on the map to your liking: shape of symbols representing features, colour and size of said symbols, the presence of a legend (a descriptive text) along with each feature represented there and some others. This section describes how to make dbMap/Web maps “your maps”.
Displaying Annotations
The ‘A’ icon will show or hide the name of the feature.
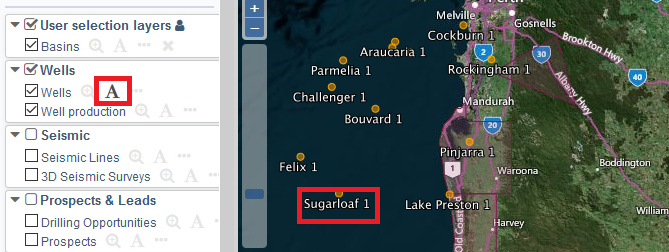
If several features are visually close together, the map system with only show a few annotations and you will have to zoom in to see annotations on each individually.
Defining colours, symbols and viability of layers
The ellipsis ‘...’ icon opens the options window for the chosen layer.
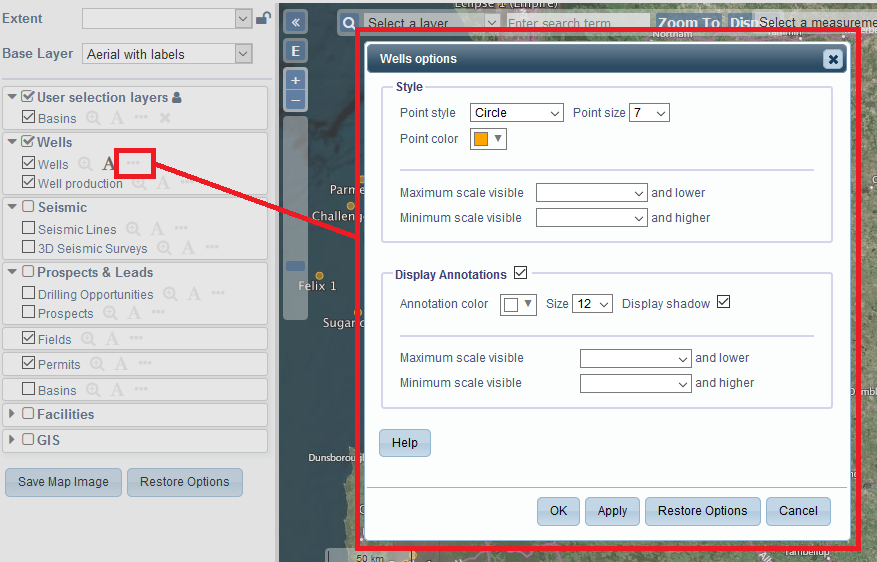
Different options will be available depending on the type of features on the layer.
Lines and points only have one color, while polygons have both an outline line color and a fill color.
Lines can have their width changed, while points can have their size changed.
Points can have the symbol changed, and if its a Well then the Well symbol can be shown – it will always be black.
All layers can be made visible or hidden based on the current zoom level.
A Maximum scale visible will hide the layer when zoomed above this scale and show it when zoomed below.
A Minimum scale visible will hide the layer when zoomed below this scale and show it when zoomed above.
The layer will be visible between these two numbers, and if you leave one number blank then there is no limit in that direction.
Annotations can be shown or hidden using the checkbox in the options window, as well as having color, size and shadow set.
Annotations can also be made visible or hidden based on the zooms scale, however annotations are always be hidden when they layer is hidden.
and
The options window has a button to ‘Apply’ the changes without closing the options window, so you can see the results of your changes and continue to make more changes.
When you are happy with your changes press the ‘OK’ button or press the ‘Cancel’ to abandon your changes.
The ‘Restore Options’ will restore all options for this layer back to the defaults.
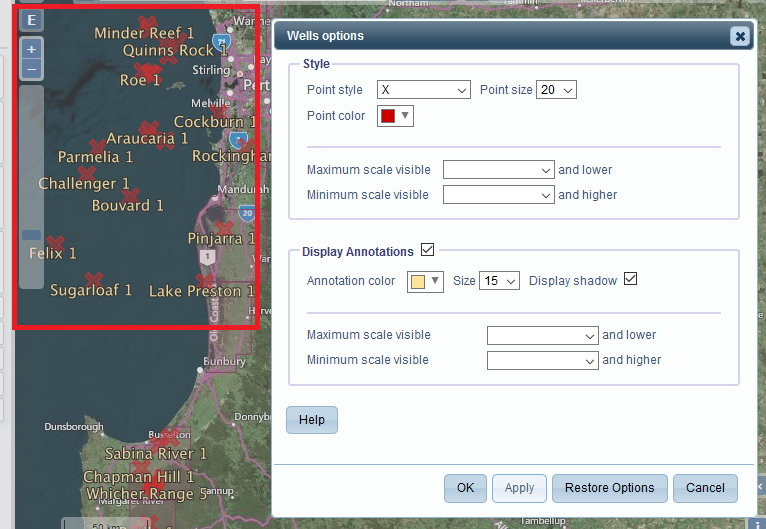
Here, we’ve changed the symbol representing each Well and the size and colour of their annotations.