Introduction
The Petrosys Well Log Viewer provides a means of displaying and interacting well log curve data from catalogued LAS and DLIS files from within dbMap/Web. The viewer can be used to display well log curves in a composite log view or as a cross-plot.
Launching the Well Log Viewer
Links to view a catalogued well log file in the Well Log Viewer are provided when working with well log data within dbMap/Web in the following modules when a well log file is selected:
Wells (Well Logs tab)
Well Log Browser
Records Management
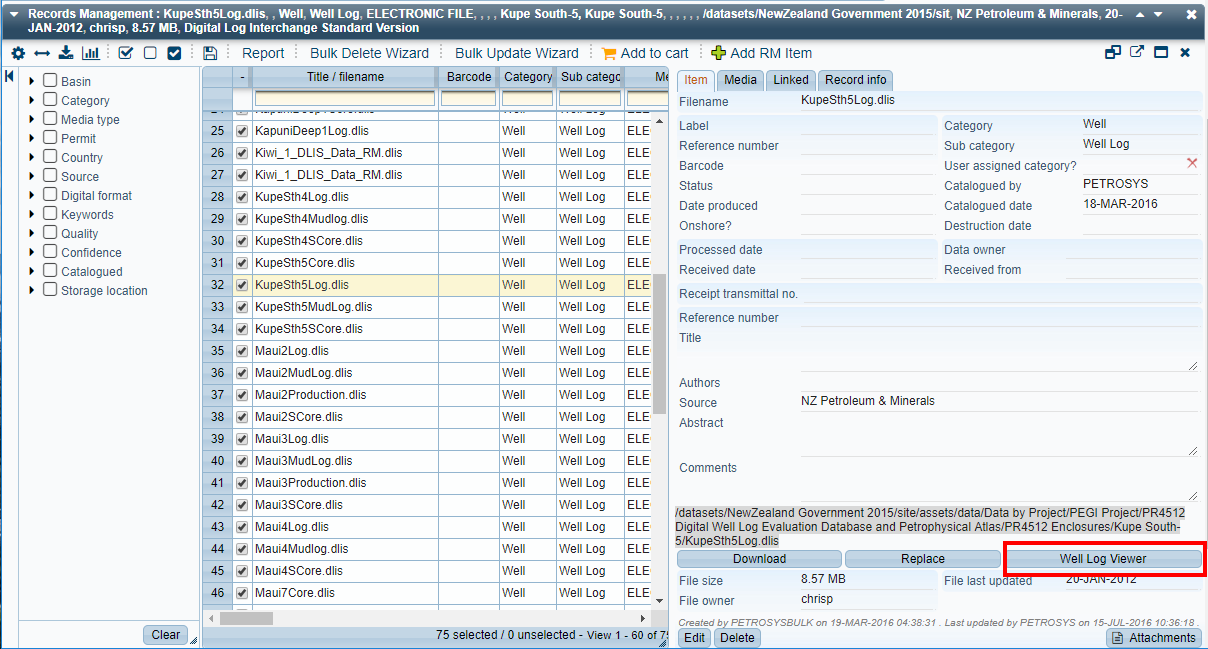
The Well Log Viewer will open in a new window.
Well Log Viewer Regions
The Well Log Viewer is comprised of three distinct regions.
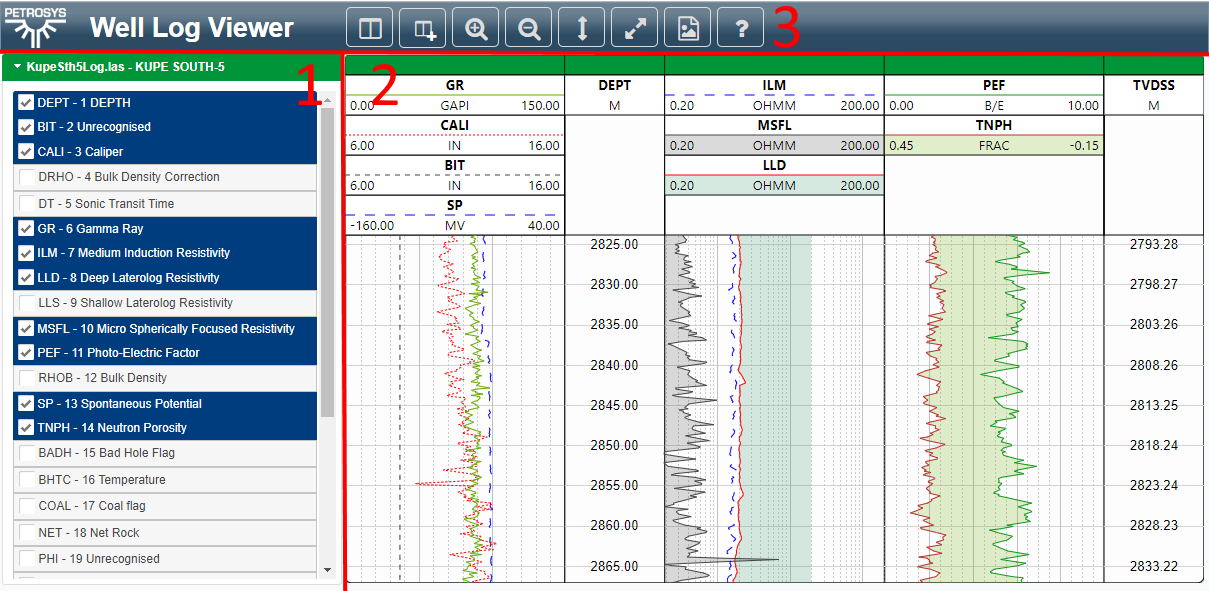
1. Data Selection Pane
The data selection pane allows you to select curves to display on the composite well log display. When a well log curve is checked on, it is displayed on a new track using its default display style. Un-check a well log to remove it from the composite display.
By default, the first depth/index curve will be selected.
Some DLIS files will contain multiple sub-files. If multiple sub-files are available, you will see a selector above the list of curves.
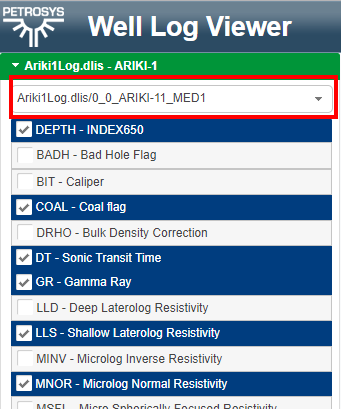
Use this to pick the correct sub-file. Note: Only one sub-file can be displayed at a time.
2. Composite Well Log Display
This is the primary region which displays the tracks and curves. When well logs are selected in the data selection pane, they are displayed here.
The display is comprised of one or more tracks. Each track contains three regions.
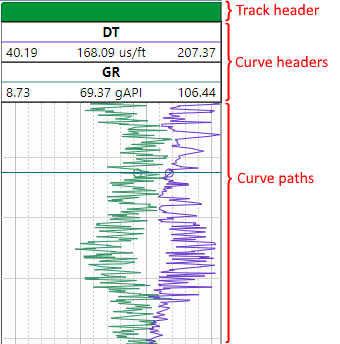
Track Header
The track header is used to interact with and customize the track. It can be used as a handle to re-order tracks using drag and drop. When you hover the mouse over a track header, icons become available to modify the track display settings and to delete the track. Note: The track settings can also be modified by double-clicking the track header.
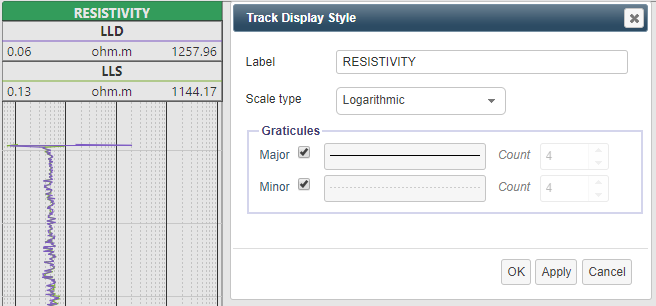
The track settings include its label, the scale type (linear or logarithmic) and the graticule display settings.
Curve Headers
Each well log curve has a curve header. The curve header is used to display identifying information about the curve. Like the track headers, the curve headers can be used to drag and drop curves between tracks or to re-order curves within the current track. Higher curves will be displayed on top of lower curves.
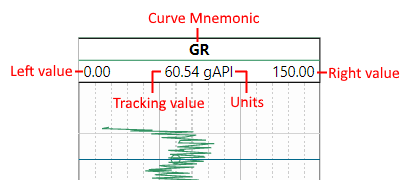
The left and right values show the value range being displayed. These values can be modified by clicking them and editing the values directly in-line. Alternatively, they can be modified using the curve settings panel.
When moving the mouse cursor over the curve display region, the value of the curve at the mouse location is displayed in the curve header.
When you hover the mouse over a curve header, icons become available to modify the curve display settings and to delete the curve. Clicking the settings icon or double-clicking the curve header will open its display style panel.
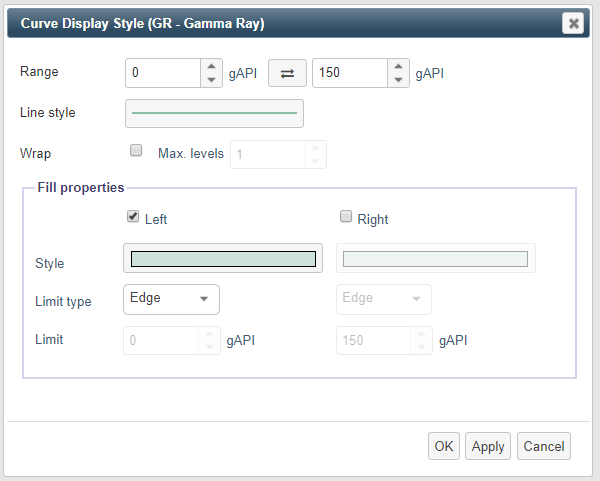
Here, the various style properties for a curve can be changed.
-

Range – The left and right values to show for the curve. The values can be swapped with the button which will reverse the displayed curve.
Line style – The curve style, color, opacity and width can be set by clicking the line style picker.
Wrap – Tick to display curve values which overflow the selected left/right range. Use the max levels selector to limit the number of times the display range will be wrapped. e.g. For the above GR display, gAPI values between 150 and 300 will be displayed if wrap is turned on, however gAPI values above 300 will not be displayed unless the maximum levels is increased.
-
Fill properties – Control the curve fill to the left and to the right of the curve.
-
Style: The fill color or gradient and opacity can be set using the fill style picker
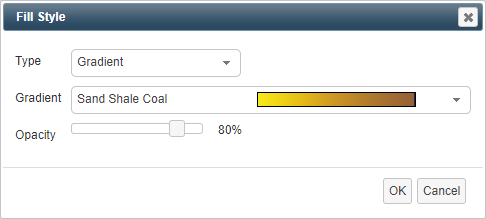
Note: dbMap/Web ships with a selection of gradients. Please contact Petrosys support for assistance with adding custom gradients.
-
Limit type:
Edge (default) – Fill from the curve value to the (left or right) edge of the track.
Fixed – Fill from the curve value to a fixed value. Set the value in the limit field.
Curve – Fill between the current curve and another curve on the same track.
Limit: For Fixed and Curve limit types, set the fixed limit or the fill-to curve.
-
Curve paths
The curve paths region is used to display the curve data. It is also used to interact with the display.
Tracking – Move the mouse cursor around in the curve paths region to display information about the displayed curves at the depth at the mouse cursor. A tracking bar is displayed in the tracks and tracking data is displayed in the curve headers.
Zoom – The display can be zoomed in or out using <Ctrl> + <Mouse wheel> or the toolbar.
Pan – The display can be panned using the mouse wheel. Alternatively, the curves can be panned by holding down the left mouse button and dragging the mouse up or down.
Note: The order curves are drawn is dependent on the order they are listed in the curve headers region.
3. Toolbar
The following functions are provided by the Well Log Viewer toolbar:
-

Switch to cross-plot mode (See Cross-plot viewer section)
-

Select a template (See Templates section).
-

Save a template (See Templates section).
-

Add a markers track (See Markers section).
-

Zoom in (an alternative to <Ctrl> + <Mouse wheel>).
-

Zoom out (an alternative to <Ctrl> + <Mouse wheel>).
-

Zoom to full extent. Resets the zoom to the default level.
-

Toggle full-screen view.
-

Export the current view to a PNG file.
-

Opens this help page.
When in cross-plot mode, the following buttons are available:
-

Switch to composite mode.
-

Open the cross-plot display settings window.
Templates

The Well Log Viewer supports templates which provide a quick way to display a set of well log curves in a pre-set layout and style. Use the button on the toolbar to open the list of templates.
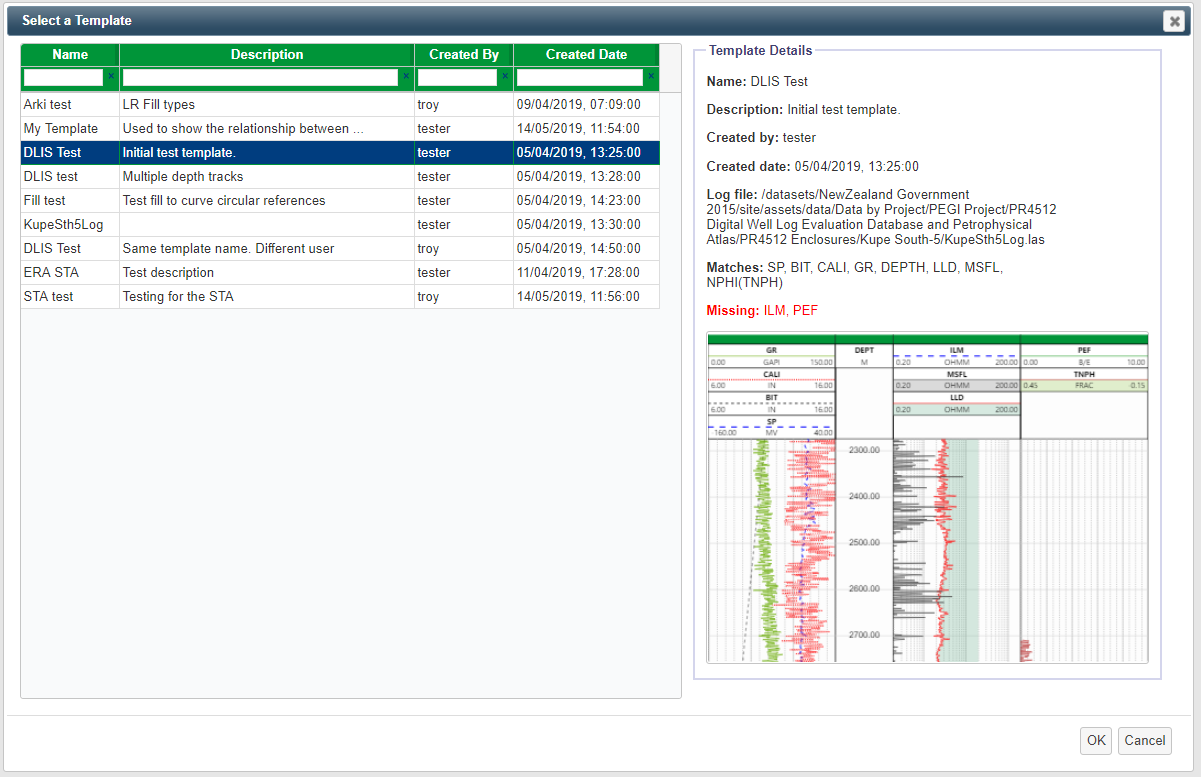
The template selector shows all templates available on the server created by all users. You can sort and filter the list of templates.
Select a template from the list and you will see some information about it in the right pane. Including a list of the curve mnemonics the template contains and a list of curve mnemonics which don’t match your current well log file. The curves are matched using their curve mnemonic primarily, secondary is the curve class.
A template can be applied with missing curves, however those curves will not be added to the display.
If the list is empty, there are no existing templates available.
Create a template

To create a new template, set up your composite well log display with the tracks, curves and styles you would like to save. Then select the button on the toolbar.
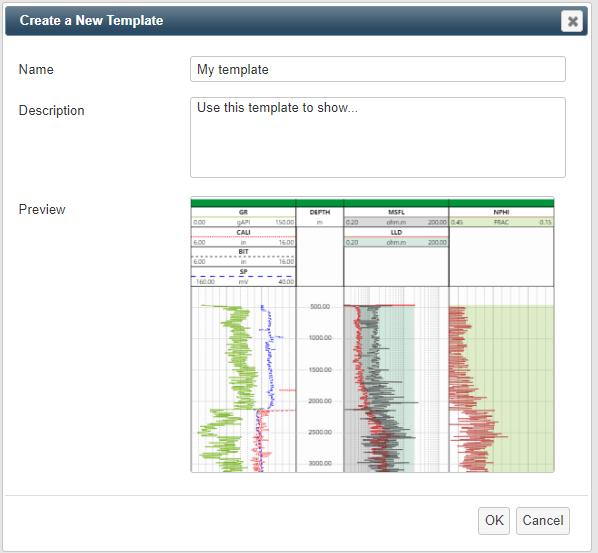
Fill in the name and description for the template (these will be shown to users in the template selector).
Once you press ‘OK’, the template will be saved on the server and available for anyone to use. If you would like to update/replace an existing template, use the same name. Note: You can only update/replace templates that you created.
Markers

Use the button on the toolbar to add a new well markers track. A well markers track can display formation tops from the dbMap/Web database for the current well.
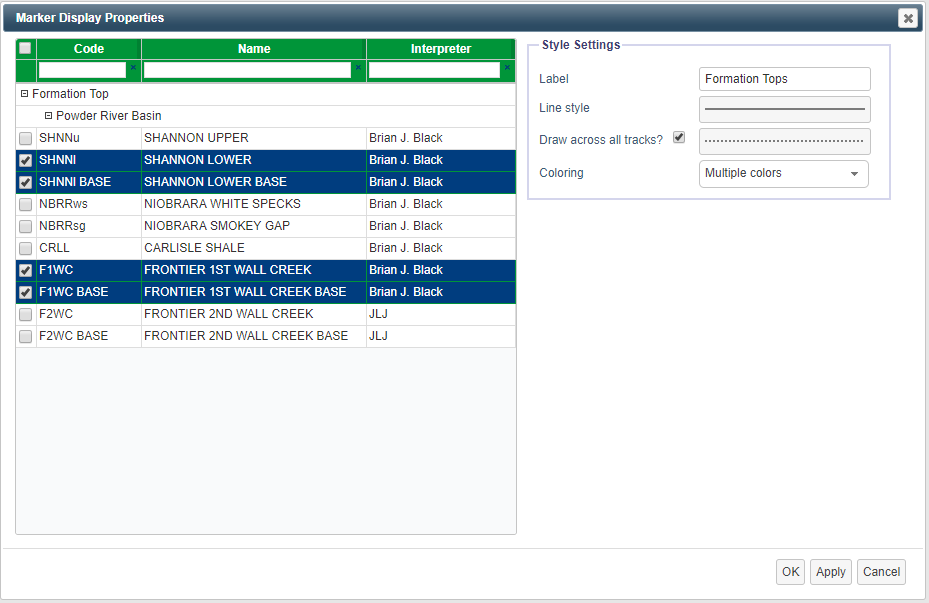
When you add a new markers track, you are presented with the Marker Display Properties dialog which allows you to select the formation tops to display and set display styles for them.
Label – The title to display on this marker track’s curve header.
Line style – The horizontal marker line style, color, opacity and width can be set by clicking the line style picker. The marker annotations use the same color.
Draw across all tracks – Check on to extend the marker lines across all tracks. You can set a separate line style to use for the other tracks.
-
Coloring – The coloring options for the marker line and annotations.
Single color: The markers are colored using the line style color.
Multiple colors: Each marker is assigned a separate color.
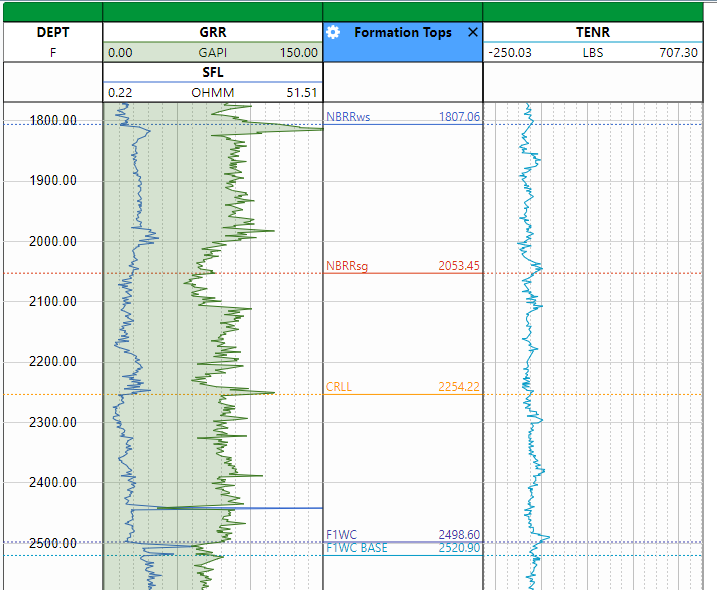
Once the marker track is displayed, you can modify its display settings using its settings icon in the same way as the curve settings.
Cross-plot viewer

The Well Log Viewer can be toggled between a composite well log curve display (default) and a cross-plot mode. Use the button to switch to cross-plot mode.
When in cross-plot mode, the options available in the toolbar are changed (See the Toolbar section).
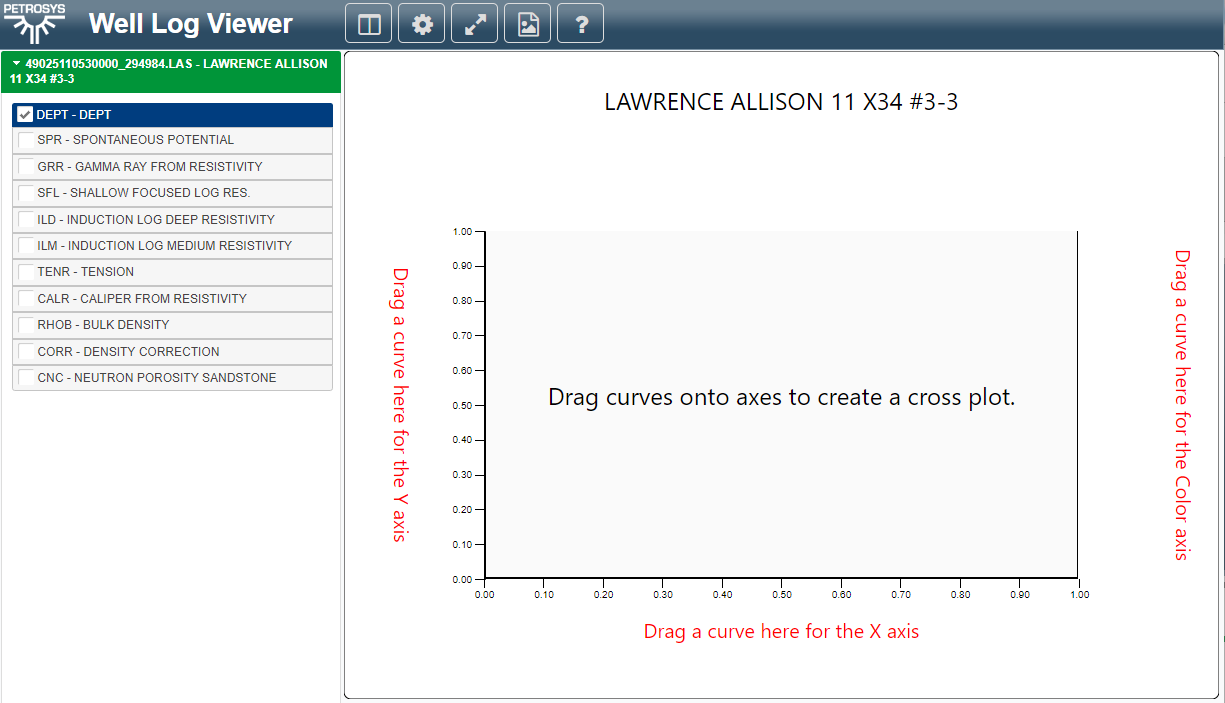
To display well log data in the cross-plot chart, you first drag a well log curve from the selection region in to each axis of the cross-plot window. As a minimum, logs must be dragged to the X and Y axis. Optionally, a third log can be dragged to the color axis (on the right).
Chart axes can be replaced at any time by dragging another well log in.
Axis settings
To modify the axis settings, double-click the axis label. This opens the Axis Settings dialog and allows you to modify the display range of the axis.


The range can be inverted using the button.
The color (Z) axis also contains a gradient which can be used to control the color of the plot points based on a third log curve.
Cross-plot settings

Either click the button on the toolbar or double-click the chart header to modify the other cross-plot settings.
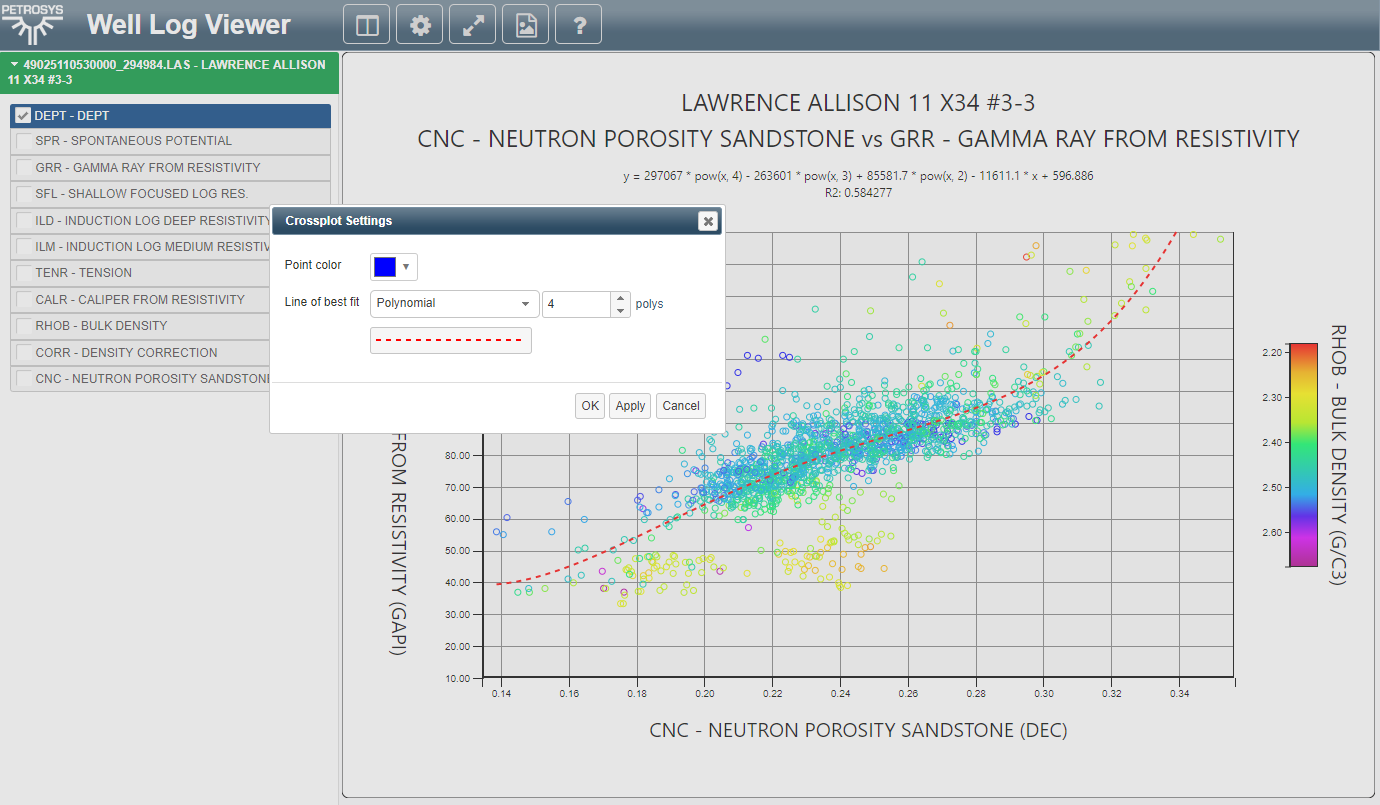
The cross-plot settings dialog gives you control over the default point color and the line of best fit calculation and display settings.