dbMap/Web – Distribution Types
The following distribution types can be used for input variables:
Constant
 | |
Inputs |
Mode |
Bounds |
User-defined |
Description |
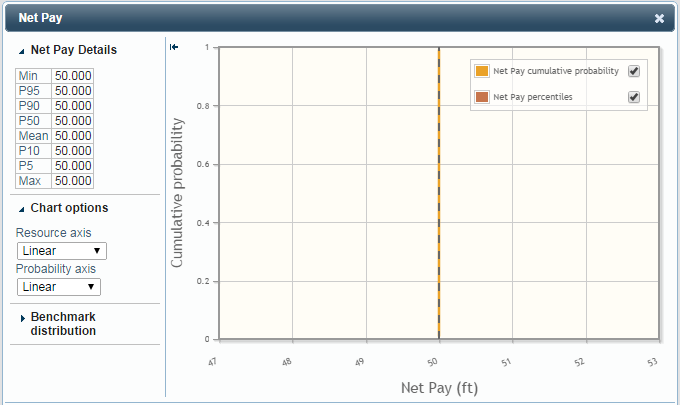
A constant distribution is a distribution of a single value. This means that there is no uncertainty in the estimate and the user knows exactly what the value is. |
Uniform
 | |
Inputs |
Any two percentiles |
Bounds |
User-defined |
Description |
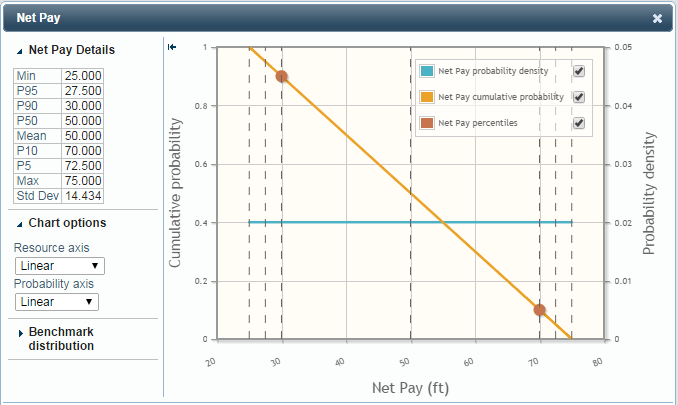
A uniform, or linear, distribution has a finite range. Every value within that range is equally likely to occur, and no value outside the range will ever occur. |
Normal
 | |
Inputs |
Any two percentiles |
Bounds |
-ve infinity, +ve infinity |
Description |
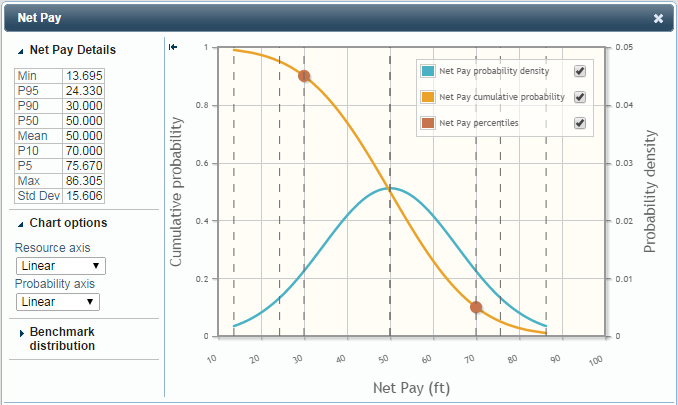
This is the distribution whose probability density forms the familiar “bell curve”. Normal distributions are unbounded, which means that in theory any value between negative infinity and positive infinity can occur, although values near the center (median/mean) of the distribution are much more likely. This makes them a poor choice for fixed-range variable like ratios (Permeability or Porosity, for instance). |
Lognormal
 | |
Inputs |
Any two percentiles |
Bounds |
0, +ve infinity |
Description |
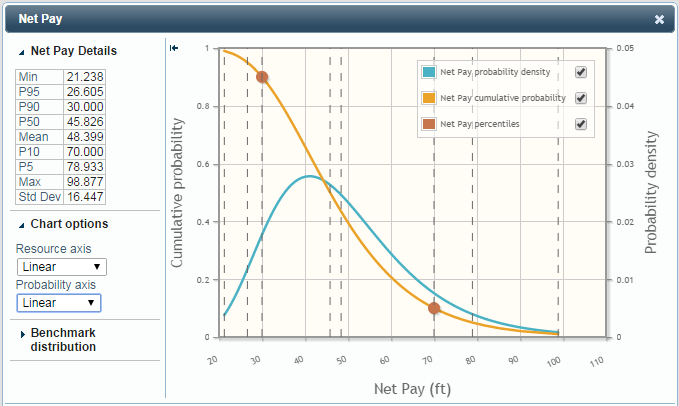
This distribution type is very common in resource estimation, since variables that are the product of multiple independent factors are well modeled by lognormal distributions. Lognormal distributions always have a lower bound of zero and no upper bound. |
Triangular
 | |
Inputs |
Min, Max, Mode |
Bounds |
User-defined |
Description |
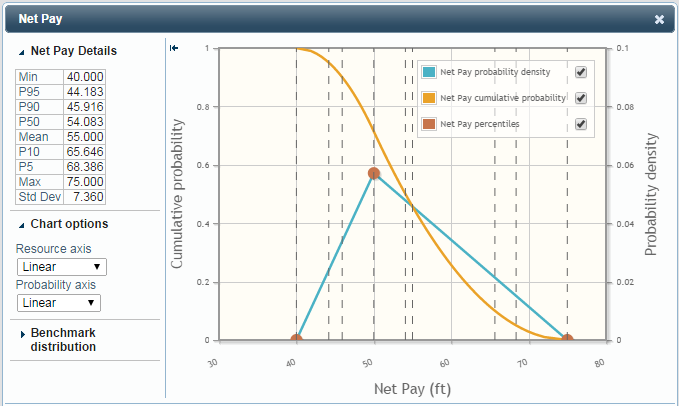
A simple distribution where probability decreases linearly from the mode (most-likely value) to the minimum and maximum values. Particulary useful in cases where data is too scarce to provide good estimates for percentiles. |
Stretched Beta
 | |
Inputs |
Min, Max, Mode |
Bounds |
User-defined |
Description |
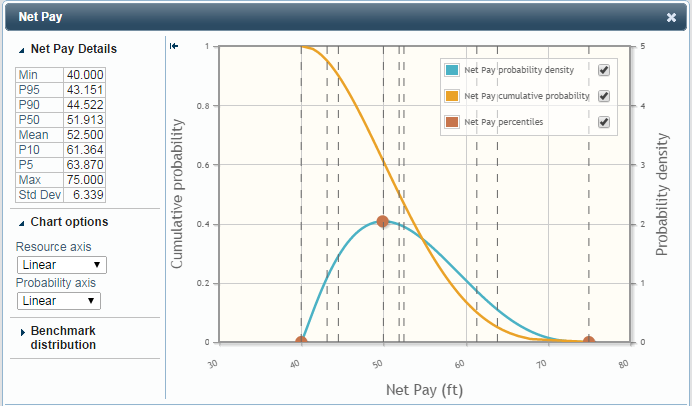
Similar to the triangular distribution, but has a smoother, more complex shape, which resembles a lognormal distribution. |
 | |
Inputs |
Min, Max, Percentiles |
Bounds |
User-defined |
Description |
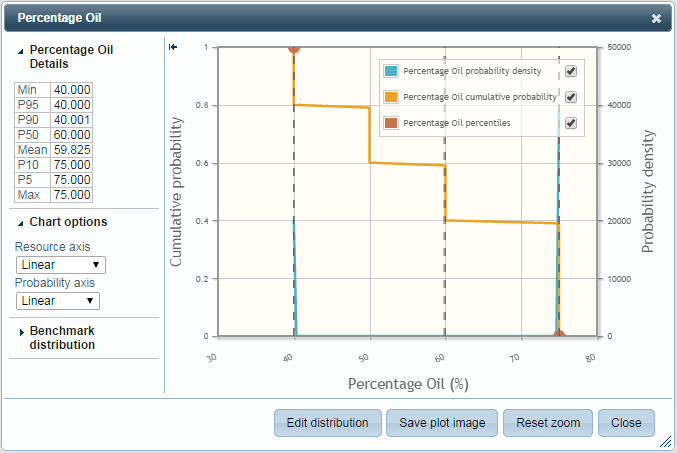
Percentiles are manually specified by the user. This can be useful in specifying multiple discrete scenarios. |
Distribution options
Each distribution has an action menu, which is opened by clicking the cog icon next to the variable name
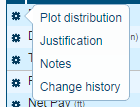 | |
Plot distribution |
Shows the distribution and summary statistics on a chart. |
Justification |
View/edit the justification for the values assigned to the distribution. |
Notes |
Extra notes and/or files associated with this distribution. |
Change history |
Shows information about the creation and last update of the database record associated with the distribution. |