dbMap/Web – Modelling Mixed Phases
Most compute methods support computations for both oil and gas. The hydrocarbon type field is used to specify whether a particular target is oil-only, gas-only, or contains both oil and gas.
If “Oil and gas” is selected, the Percentage Oil input variable is used to specify how much of each hydrocarbon is present as a percentage of the total volume of the reservoir. This is a standard input variable, and any distribution type can be used, which allows much more flexibility than a single constant value.

Some common cases and ways to model them are described in more detail below.
Examples
Fixed ratio – 30% Oil, 70% Gas
This means that every iteration in the simulation will have an Oil percentage value of 30%. This can be achieved by using a constant distribution with a mode of 30.

Variable ratio between 100% Oil and 100% Gas
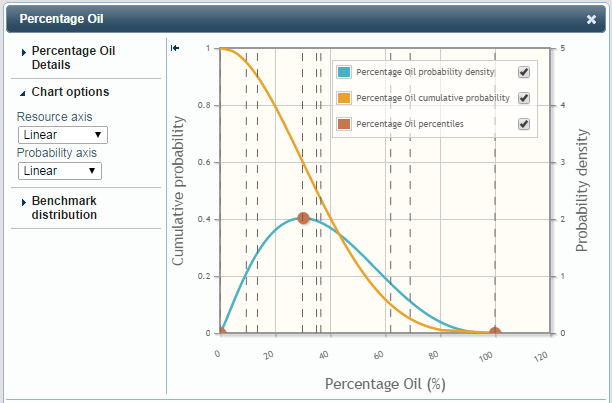
In this case, there is an oil/gas mix, but the ratio of oil to gas is not well-known. Any distribution can be used in this case, but generally a bounded distribution like triangular or beta is used. In the example below, the most-likely value is 30%, but every value between 0% and 100% has a chance of occurring.

 |
Scenario-based. 40% chance of oil only, 40% chance of oil and gas, 20% chance of gas only
Often it is not known in advanced what the hydrocarbon make-up of a reservoir will be. Rather, there is a chance of there being only oil, a chance of only gas and a chance of a mixture of the two. To model this situation, a custom distribution can be used.
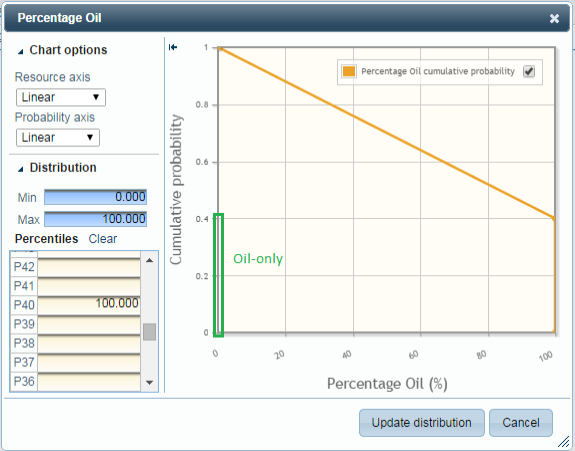
40% chance of oil only
This means that 40% of the time, the Oil Percentage is 100%. This means that the percentiles from P40 – P0 must all equal 100. Resource computation charts show cumulative probability, which ranges from 0 – 1, rather than 0 – 100%, so P40 is the same as a cumulative probability of 0.4.

20% chance of gas only
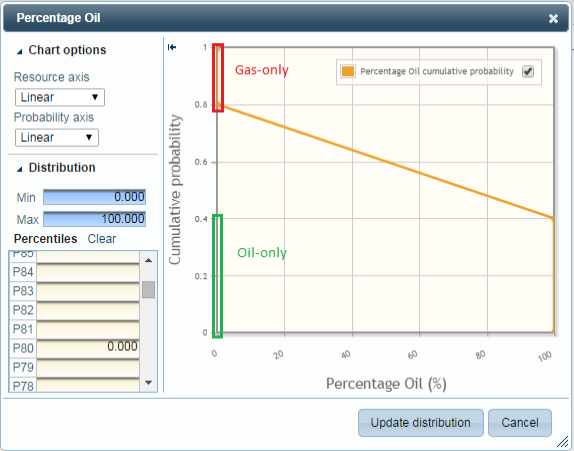
Similarly, this means that 20% of the time, the Oil Percentage is 0%. So, percentiles from P100 – P80 are zero.

40% chance of oil + gas
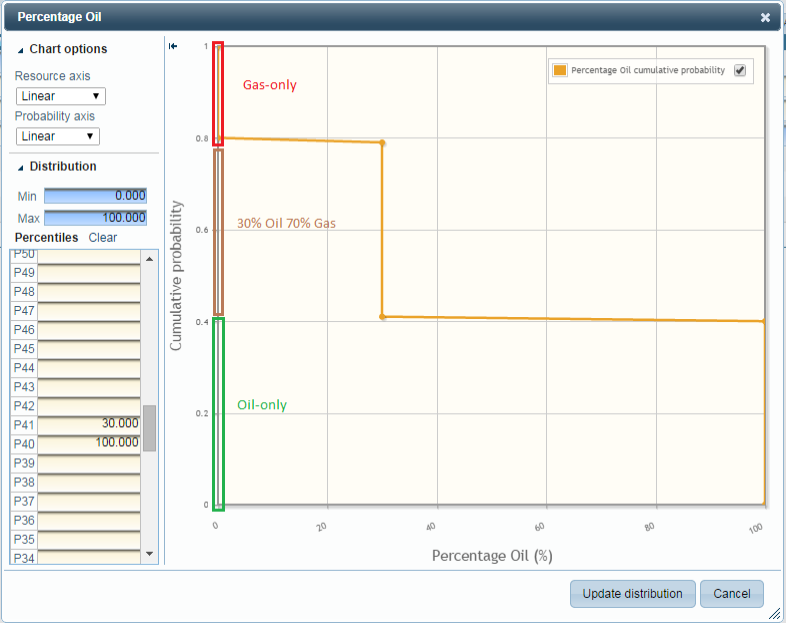
Oil/Gas mixtures are represented by Oil Percentage values between 0% and 100%. Since custom distributions use linear interpolation between user-specified percentiles, as shown in the above chart, the range from P80 – P40 is an Oil/Gas mix uniformly distributed from 0% to 100%. By entering values for percentiles between P80 and P40, this distribution can be enhanced to better represent the expected Oil/Gas ratio for the cases where there is a mixture. For instance, to set a fixed ratio of 30% Oil for these cases, set P79 and P41 to 30.

Note that this is still an approximation, as it does no take into account values between P80 and P79 and between P41 and P40.